This use case attempts to demonstrate Survol capability to visualize on the same display, resources from different machines. Two Survol agents are running on the client and the server, and their data need to be displayed on the same window.
SETUP
We want to focus on processes that Apache might not be able to access, notably because Linux security is quite strict. This is why Survol, on the client side, is started from a script, with the same user as the one running the telnet access.
[rchateau@fedora22 rdfmon-code]$ survol/scripts/cgiserver.py --address 192.168.0.17
Platform=linux2
Version:sys.version_info(major=2, minor=7, micro=10, releaselevel='final', serial=0)
Server address:81.200.64.50
Opening 192.168.0.17:8000
os.environ['PYTHONPATH']=/home/rchateau/rdfmon-code/survol
Url:http://192.168.0.17:8000/survol/www/index.htm
server=192.168.0.17
Similarly, on the server, Survol is started from a script:
C:\Users\rchateau\Development
>cd C:\Users\rchateau\Development\PythonStyle
C:\Users\rchateau\Development\PythonStyle>python survol\scripts\cgiserver.py
Platform=win32
Version:sys.version_info(major=2, minor=7, micro=10, releaselevel='final', serial=0)
Server address:192.168.0.14
Opening rchateau-HP:8000
os.environ['PYTHONPATH']=survol
Url:http://rchateau-HP:8000/survol/www/index.htm
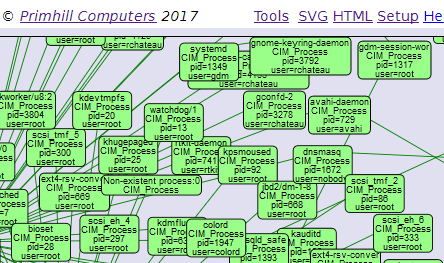
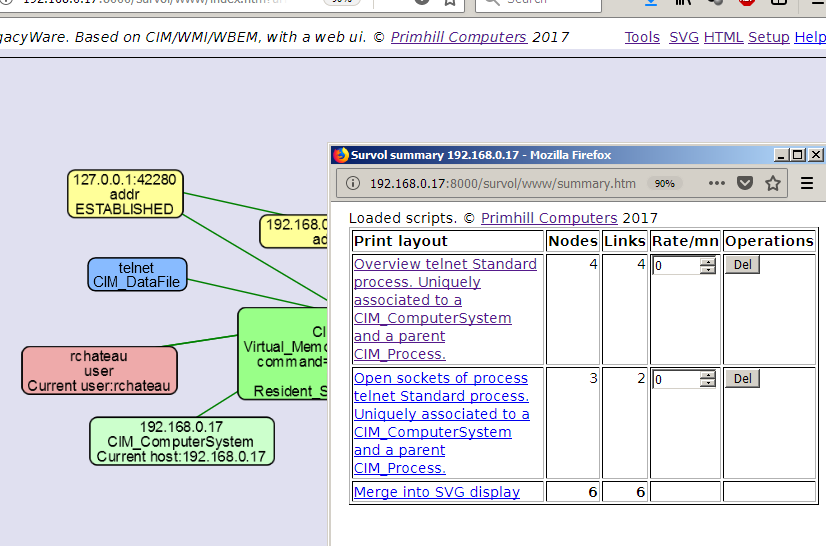
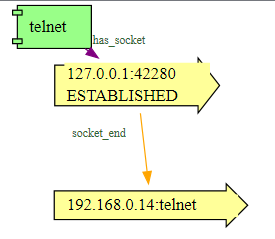
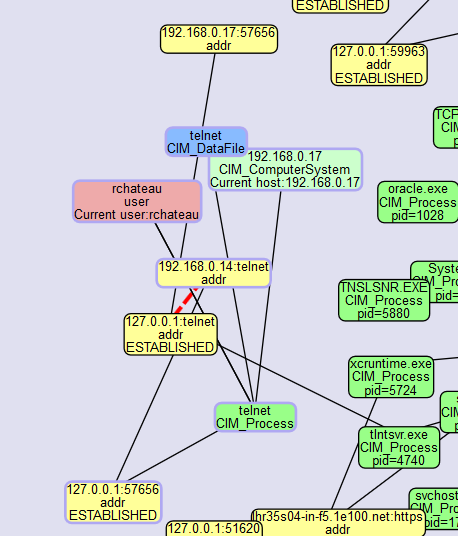
The plan, here, is to examine a telnet session between a Linux client telnet, IP address 192.168.0.17 and a Windows telnet server, 192.168.0.14. Let's start the telnet session on the Linux machine:
[rchateau@fedora22 rdfmon-code]$ telnet 192.168.0.14
Trying 192.168.0.14...
Connected to 192.168.0.14.
Escape character is '^]'.
Welcome to Microsoft Telnet Service
login: rchateau
password:
*===============================================================
Microsoft Telnet Server.
*===============================================================
C:\Users\rchateau>
This document details each steps of the investigation.
CLIENT SIDE INVESTIGATION
Let's start this investigation by examining the default output of the Javascript display. This interface gives a global vision of the many processes running on the Linux machine and their mutual dependencies. It is convenient as it gives a full picture of the machine's activity. Also, it allows to right-click any node of this graph to display more specialized information which are combined with the current graph. It is also possible, by right-clicking on the background, to open a contextual menu of various information.
This display type, on a very busy machine, might give too much information. Also, the routing algorithm creates a moving, very dynamic and constantly adapting image which might not suit all needs.
This is not an issue as they are several other display types, that we are going to test with the same data.
Another interface type is a plain HTML output which allows even better searching. This is entirely in text, so when documenting an application, instead of "snipping" screen copies, it is possible to manipulate HTML copy/paste buffers, as in this document. Two other output types are possible: JSON, used by the D3 interface, and RDF.
Now, we can actually examine this process: let's click on the client telnet process and see the HTML output:
OVERVIEW TELNET
Standard process. Uniquely associated to a CIM_ComputerSystem and a parent CIM_Process.
CIM_ProcessStandard process. Uniquely associated to a CIM_ComputerSystem and a parent CIM_Process.
Class CIM_ComputerSystem
192.168.0.17 Current host:192.168.0.17
Class CIM_Process
telnet | 192.168.0.17 | |
rchateau | ||
Resident_Set_Size | 2236416 B | |
Virtual_Memory_Size | 15446016 B | |
command | telnet 192.168.0.14 | |
pid | 4483 | |
runs | telnet | |
user | rchateau |
Beyond some general purpose information, it shows several links. But now that we are able to focus on a single process, let us switch back to D3 mode, because it allows some features we will need. Please click on the "D3" URL at the end of the page.
This Javascript (D3-based) output shows the same basic information as the HTML page, but in a more interactive representation. The user can zoom and pan the image, but also right-click on each resource to bring extra information to be merged in the current graph. Right-clicking on the "Telnet" boxes opens a list of script. Each of these scripts runs on the server and returns some specific information about the current node: here is the telnet process. It is absolutely safe to try any script, but for the moment, we are focusing on sockets and communication with the telnet server process, running on the Windows machine 192.168.0.14.
Let's choose "Open sockets" which gets the list of sockets open by this process, and merge the result into the current graph.
The results of several commands have been combined into a single display:
These two data can be displayed together, or separately. This merge can be done with any kind of script/command. The result is more interesting when several commands share nodes.
Another window, we did not talk about yet summarizes all commands merged together in a D3 display. It is called "Tools". Let's see what it looks like:
As indicated in the header, each information comes with the number of nodes and links, a button to remove it from the display, and a refresh rate to periodically refresh the display by reloading the information. We do use these features in this use case.
The links listed in the Summary window can be clicked on separately: they will display their individual results into a static SVG display (Of course, from there, you can switch to the D3 or text display). You can also see the result of their merge, in static SVG format, which can be quite convenient for printing. It allows to build a specific set of data with all types of interfaces and, when finished, generate a static representation. Of course, it is static in its structure, but is automatically updated each time it is displayed.
Another very important feature of the Summary windows is that each of the links can be drag-and-dropped into another browser window, specifically if this browser is connected on another Survol agent. This allows merging data from several agents and several machines. We will use that later.
SERVER SIDE INVESTIGATION
Now, we want to see what happens on the server when the telnet client on 192.168.0.17 Linux machine is connected onto it... First problem, we have no idea of the process it is connected to. On Windows, apparently, no "telnet server" process is running. Let's open the D3 interface, and have a look at the open sockets:
Many sockets are displayed, with their connected servers, but we do not know which one is connected to the client. As explained before we will drag-and-drop the second link from the Summary window of the client agent, "Open sockets of the telnet process". This client-side socket pair will be displayed along with the server-side socket pairs. We expect to see, in the same display, the same socket pairs as seen from the telnet client and from the telnet server.
This is the result of the merge. Several remarks:
Please open the summary window of the server agent by clicking on "Tools". One can see that a new line representing the open sockets of the client telnet process is now added. And, as they are mixed data from an external agent (The server one), Survol associates a specific color for all resources of this agent, address 192.168.0.17, port number 8000.